Using the nuclear module
The nuclear module provides the user with various type of nuclear data and can be useful in the interpretation and verification of gamma spectra. The module is constantly updated with new functions to help the user in various tasks.
The nuclear module uses various sources of data. Gamma energy transition have been obtained from the The Lund/LBNL Nuclear Data Search while decay chains and other data, such as decay branching ratios, have been taken directly from the radioactivedecay python pacakge.
Nuclide search and identification
In the previous tutorials we showed how a gamma spectrum can be loaded, calibrated and how the user can perform a peak search allowing the individuation of the main gamma lines.
Once the energy of a peak has been determined, we can try to assign it to a particular gamma emitter. To do so, the nuclear module provides a search_gamma_line function that allows the user to search for all the gamma emitters having gamma energies close to the detected one. To show how this can be done, let us consider the spectrum used in the previous tutorials as an example:
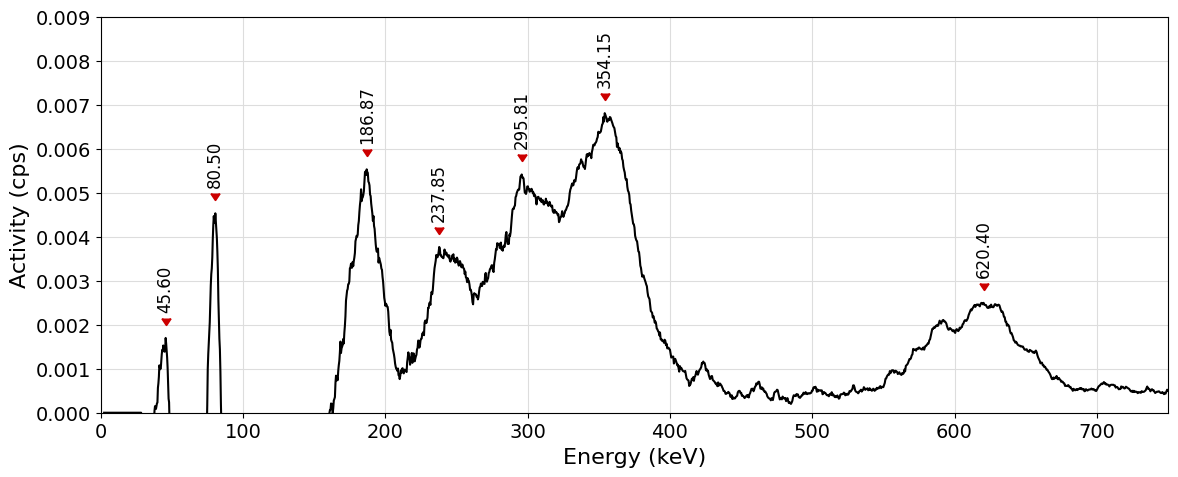
Let us look at the spectrum and try to identify the peak that has been located at \(186.87 \mathrm{keV}\). To do so, let us interrogate the search_gamma_line function by looking for gamma lines of energy centered around that energy with a range of \(\pm 1\mathrm{keV}\). This can be done as follows:
from pygammaspec.nuclear import search_gamma_line

gamma_lines = search_gamma_line(186.87, delta=1)

print(f"{len(gamma_lines)} possible gamma emission have been found\n\n")
123 possible gamma emission have been found
As can be seen 123 possible gamma emitters fall in the selected range. To help us out, let us apply some filering based on the nuclide halflife and gamma line intensity. This can be done acting directly on the halflife_threshold and intensity_threshold of the search_gamma_line function. Starting from the assumption that the sample has beeen acquired from a commonly existing item let us discard nuclides with short half-life smaller than, let’s say, \(60s\). Please notice how this hypothesis if valid only in the case of long-lived isotopes and would not work in the identification of those peaks associated with short lived decay daughters. Furthermore, given the small acitvity of the sample, let us exclude the low intensity bands, that would not contribute much to the spectrum, by setting \(1\%\) as the lowest intensity:
gamma_lines = search_gamma_line(186.87, delta=1, halflife_threshold=60, intensity_threshold=1)

print(f"{len(gamma_lines)} possible gamma emission have been found\n\n")


print("{:^8}  {:^6}  {:^10}   {:<10}{:^6}".format("E(keV)", "I(%)", "t1/2(s)", "nuclide", "decay"))
print("-------------------------------------------------------")
for line in gamma_lines:
  energy, intensity, decay, halflife, nuclide, _  = line
  print("{:>8}  {:>6}  {:>10}   {:<10}{:<6}".format(f"{energy:.3f}", f"{intensity:.2f}", f"{halflife:.2e}", nuclide, decay))
32 possible gamma emission have been found


 E(keV)    I(%)    t1/2(s)     nuclide   decay
-------------------------------------------------------
 185.930    1.74    5.04e+02   Au-187    e+b^+
 186.000    7.00    1.80e+02   Pt-182    e+b^+
 186.050    4.80    1.06e+05   Ac-226    e
 186.150    1.30    8.46e+03   Pt-187    e+b^+
 186.150    1.76    2.41e+04   Pa-234    b^-
 186.170    9.40    6.35e+04   Au-193    e+b^+
 186.200    8.50    8.10e+03   W-177     e+b^+
 186.211    3.59    5.05e+10   Ra-226    a
 186.274    3.37    1.98e+03   Ho-159    e+b^+
 186.380   21.60    1.50e+03   Rn-221    b^-
 186.400    3.30    1.75e+04   Hg-192    e
 186.420    7.80    8.10e+03   W-177     e+b^+
 186.500    3.11    4.23e+04   Bi-203    e+b^+
 186.500    6.80    3.40e+02   Rn-206    e+b^+
 186.680    2.23    3.91e+04   Pt-189    e+b^+
 186.718   27.80    1.15e+04   Re-190m   b^-
 186.718   48.40    1.86e+02   Re-190    b^-
 186.718   52.40    1.02e+07   Ir-190    e+b^+
 186.718   66.30    1.17e+04   Ir-190m2  e+b^+
 186.718   70.20    5.94e+02   Os-190m   IT
 186.770    3.00    6.78e+02   Ho-158    e+b^+
 186.800    1.70    6.12e+02   Ce-131    e+b^+
 186.800    5.00    3.90e+02   Os-179    e+b^+
 187.000   37.20    1.28e+03   Ho-158m2  e+b^+
 187.200    5.50    1.86e+02   No-255    a
 187.220    4.30    1.48e+04   Tb-149    e+b^+
 187.280    3.90    8.46e+03   Pt-187    e+b^+
 187.400    1.66    3.78e+04   Ir-187    e+b^+
 187.590   19.40    8.81e+06   Pt-188    e
 187.600   16.50    1.57e+04   Bk-244    e+b^+
 187.800   12.00    2.94e+02   Ta-169    e+b^+
 187.870    1.26    5.31e+04   Y-86      e+b^+
Looking at the list of possible gamma emitters one can now proceed by exclusion discarding exotic elements and decay modes. Among the possible candidates \(^{226}\mathrm{Ra}\), deriving from the decay of naturally occurring \(^{238}\mathrm{U}\), appears to be the most plausible candidate with an energy of \(186.211\mathrm{keV}\).
Searching for decay daughters
In the previous section we assigned the peak at \(186.87\mathrm{keV}\) to the \(^{226}\mathrm{Ra}\) nuclide. Such a nuclide can decay forming a series of radioactive daughters that, possibly, can in turn be source of other gamma ray peaks. It is wise, as such, to verify if those peaks are present in the spectrum.
to do so, we can use the decay_products function of the nuclear module. The function returns all the possible decay producto of a given nuclide and stops only when a stable isotope has been detected. To use the function, the following syntax can be used:
from pygammaspec.nuclear import decay_products

daughters = decay_products("Ra-226", branching_ratio_threshold=0.01)

print(daughters)
['Ra-226', 'Rn-222', 'Po-218', 'Pb-214', 'Bi-214', 'Po-214', 'Pb-210', 'Bi-210', 'Po-210', 'Pb-206']
where we used the branching_ratio_threshold to discard all the branches with less than \(1\%\) probability.
Once a decay daughter has been found, possible gamma lines associated to the nuclide can be searched using the nuclide_gamma_lines function from the nuclear module. Let us proceed in order by considering the case of the Pb-214 nuclide (Po-218 is not a gamma emitter).
from pygammaspec.nuclear import nuclide_gamma_lines

energies, intensities = nuclide_gamma_lines("Pb-214")

print(f"A total of {len(energies)} gamma lines has been found")
print(f"Intensity range from {max(intensities):.2e} to {min(intensities):.2e}")
A total of 29 gamma lines has been found
Intensity range from 3.76e+01 to 4.00e-03
As can be seen a moltitude of transitions are possible for the nuclide. To obtain the most relevant gamma emissions we can filter by intensity either maually, by setting a threshold with the keyword intensity_threshold, or automatically by using the limit_intensity option. The latter automatically searches for the highest intensity transition for the nuclide and returns only those transition that are at least \(10\%\) of the maximum intensity. Using the latter option we can obtain the following result:
energies, intensities = nuclide_gamma_lines("Pb-214", limit_intensity=True)

print("E (keV) \tI (%)")
print("----------------------")
for energy, intensity in zip(energies, intensities):
  print(f"{energy:.3f}  \t{intensity:.2e}")
E (keV) 	I (%)
----------------------
241.997  	7.43e+00
295.224  	1.93e+01
351.932  	3.76e+01
As can be seen, three transitions are possible for the \(^{214}\mathrm{Pb}\) and can in fact be associated to the three peaks immediately of the right of the \(^{226}\mathrm{Ra}\) peak.
Predicting the position of decay daughters peaks
What has been done in the previous example can also be automated using the decay_products_spectrum function of the nuclear module. The function, once given a father nuclide, will automatically search for all gamma lines associated to the decay chain. Filtering of the obtained gamma lines can also be applied directly from the function call using the branching_ratio_threshold,intensity_threshold and limit_intensity keywords. As an example, for the case of Ra-226 the following result can be obtained:
from pygammaspec.nuclear import decay_products_spectrum

nuclides, energies = decay_products_spectrum("Ra-226", branching_ratio_threshold=0.1, limit_intensity=True)

for nuclide, energy in zip(nuclides, energies):

 # keep only energy within the recorded spectrum
 if energy > 800:
   continue

 print("{:<10}{:>8} keV".format(nuclide, f"{energy:.3f}"))
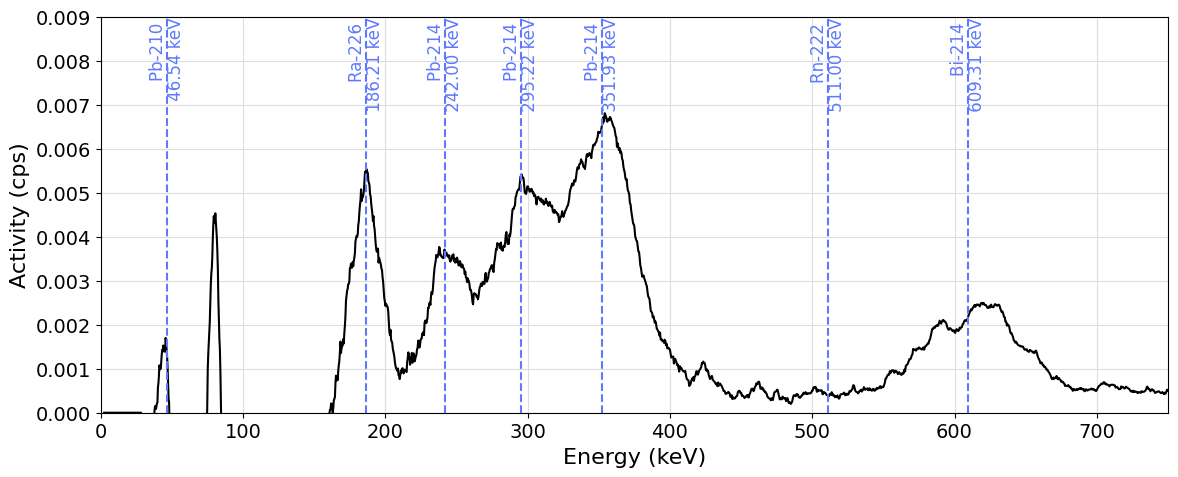
Ra-226     186.211 keV
Rn-222     511.000 keV
Pb-214     241.997 keV
Pb-214     295.224 keV
Pb-214     351.932 keV
Bi-214     609.312 keV
Bi-214     768.356 keV
Po-214     799.700 keV
Pb-210      46.539 keV
The result of the decay_products_spectrum function can also be examined graphically directly using the plot_spectrum function from the pygammaspec.visualization module. The function accepts a nuclide keyword that, when set, automatically provides some indication about the expected positions of the gamma lines of the various decay products:
from pygammaspec.spectrum import GammaSpectrum, Calibration
from pygammaspec.visualization import plot_spectrum

sample = GammaSpectrum.from_PRA_histogram("../utils/weak_radium.txt", 25851)
background = GammaSpectrum.from_PRA_histogram("../utils/background.txt", 25851)
calibration = Calibration.from_calibration_file("../utils/calibration.txt")

spectrum = (sample-background).average_smoothing(10)
spectrum.calibration = calibration

plot_spectrum(spectrum, enrange=(0, 750), yrange=(0, 0.009), nuclide="Ra-226")
X-ray emissions
The nuclear module also provides a simple interface to X-ray data listing a wide range of characteristic emissions associated with various elements.
Similarly to what already shown for the identification of gamma ray peaks, also X-ray emisison can be seached based on energy. This can be done using the function search_x_ray_line:
from pygammaspec.nuclear import search_x_ray_line

lines = search_x_ray_line(11.91, delta=0.1)

for line in lines:
  print(line)
[11.812, 'Tl', 'L_{b6}']
[11.824, 'Hg', 'L_{b1}']
[11.826, 'As', 'K_{b5}']
[11.864, 'As', 'K_{b2}']
[11.867, 'As', 'K_{b4}']
[11.871, 'Np', 'L_{l}']
[11.878, 'Br', 'K_{a2}']
[11.896, 'Fr', 'L_{a2}']
[11.915, 'Hg', 'L_{b2}']
[11.916, 'Au', 'L_{b5}']
[11.924, 'Br', 'K_{a1}']
[11.931, 'Tl', 'L_{b4}']
[11.955, 'Re', 'L_{g6}']
[11.992, 'Hg', 'L_{b3}']
[12.009, 'Re', 'L_{g2}']
All the characteristic X-ray associated with an element can be listed using the element_x_ray_lines function according to:
from pygammaspec.nuclear import element_x_ray_lines

energies, shells = element_x_ray_lines("Au")

print("E (keV)   Shell")
print("----------------")
for energy, shell in zip(energies, shells):
  print(f"{energy:.3f}\t   {shell}")
E (keV)   Shell
----------------
8.494	   L_{l}
9.628	   L_{a2}
9.713	   L_{a1}
10.309	   L_{h}
11.160	   L_{b6}
11.205	   L_{b4}
11.442	   L_{b1}
11.576	   L_{b2}
11.610	   L_{b3}
11.916	   L_{b5}
13.382	   L_{g1}
13.709	   L_{g2}
13.731	   L_{g6}
13.807	   L_{g3}
66.372	   K_{a3}
66.991	   K_{a2}
68.806	   K_{a1}
77.577	   K_{b3}
77.982	   K_{b1}
78.477	   K_{b5}
80.130	   K_{b2}
80.382	   K_{b4}