Visualizing titration curves
Once a system has been defined, its titration curve with a strong acid or base can be easily obtained. To do so, the plot_titration_curve method of the System class must be provided with the protonic balance of the solution and the titration setup information such as the initial volume and titrant concentration.
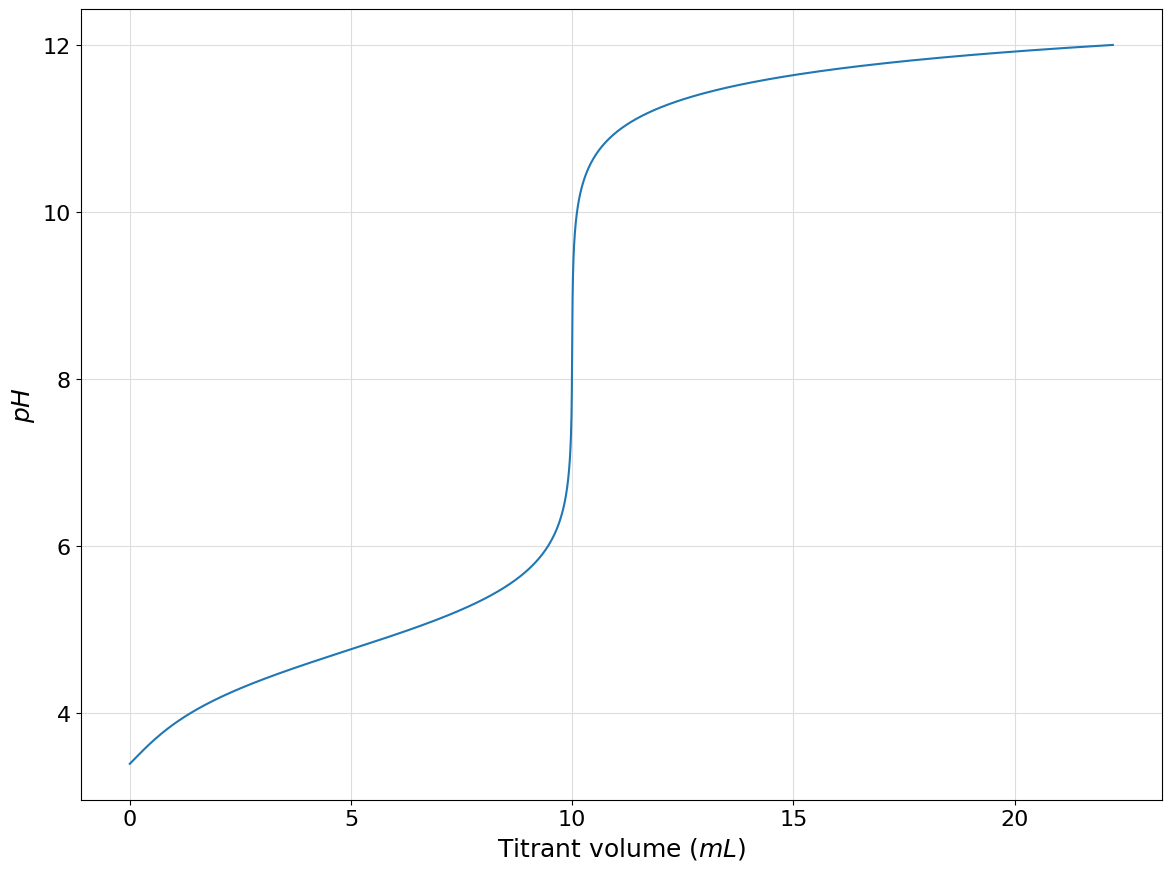
As an example let us consider the case of the titration of \(100mL\) of a \(0.01M\) solution of acetic acid with a \(0.1M\) solution of strong base such as sodium hydroxide.
from pypH.acid import Acid, Hydronium, Hydroxide
from pypH.system import System

acetic_acid = Acid([4.756], 0.01, names=["$CH_3COOH$", "$CH3COO^-$"])

system = System()
system.add(acetic_acid)

left = Hydronium.to_auxiliary()
right = Hydroxide.to_auxiliary() + acetic_acid(1)

protonic_balance = left - right

system.plot_titration_curve(
    protonic_balance=protonic_balance,
    with_acid=False,
    solution_volume=100,
    titrant_concentration=0.1,
    delta_volume=0.001,
)
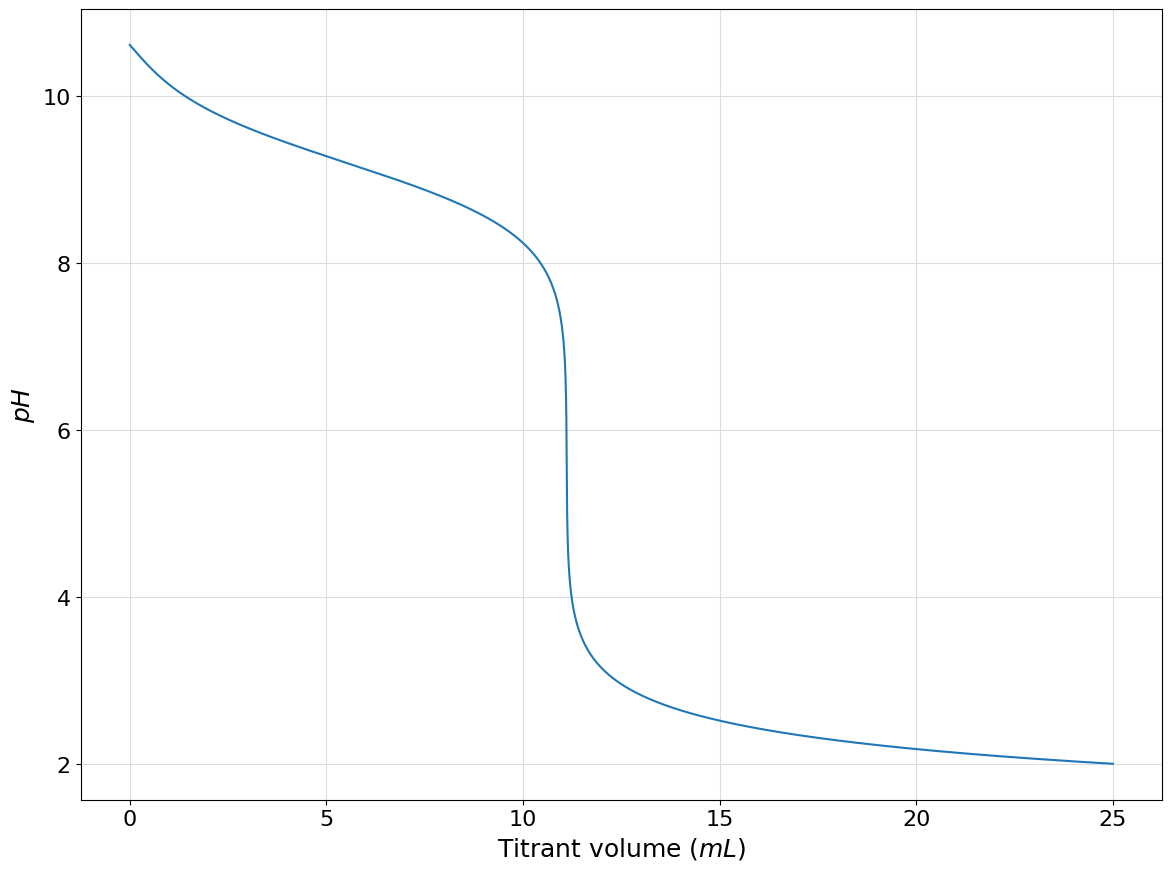
In similar manner the titration curve of \(100mL\) of a \(0.01M\) solution of ammonia with a \(0.1M\) solution of strong acid such as hydrocloric acid can be plotted using the following code:
from pypH.acid import Acid, Hydronium, Hydroxide
from pypH.system import System

ammonium = Acid([9.24], 0.01, names=["$NH_4^+$", "$NH_3$"])

system = System()
system.add(ammonium)

left = Hydronium.to_auxiliary() + ammonium(0)
right = Hydroxide.to_auxiliary()

protonic_balance = left - right

system.plot_titration_curve(
    protonic_balance=protonic_balance,
    with_acid=True,
    solution_volume=100,
    titrant_concentration=0.1,
    delta_volume=0.001,
    use_dilution=False
)